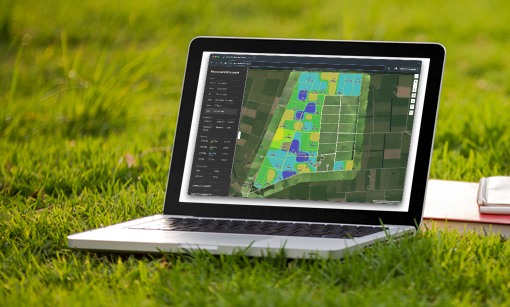
Revive Soil Solutions releases a new more inclusive version of the dashboard with broader appeal.
At Revive we believe that the most effective and efficient way to improve soil health is to start with soil analysis that can be pinpointed back to an exact location.
Measurement trumps modelling every time.
In this way we can implement a strategy and then monitor the same locations in the following season to assess whether or not we are trending in the right direction. The best results are seen when we use a grid testing method as this allows us to visually understand each nutrient’s deficiencies as well as excesses – allowing us to build a bespoke variable rate recommendation that addresses only the problem areas. By starting with the soil we give the farmer the best chance at producing nutrient dense feed, reduce animal health issues and put more milk in the vat.
For all its benefits though we have found that many potential customers are put off by the reasonably significant up front cost of the soil sampling and analysis (for dairy we test on a 2ha grid and with high value crops like Kiwifruit we prefer a 0.25ha grid).
To make the tool more widely available and reduce the barrier to entry we have accommodated those farmers who have already spent the money on either transects or all paddock testing.
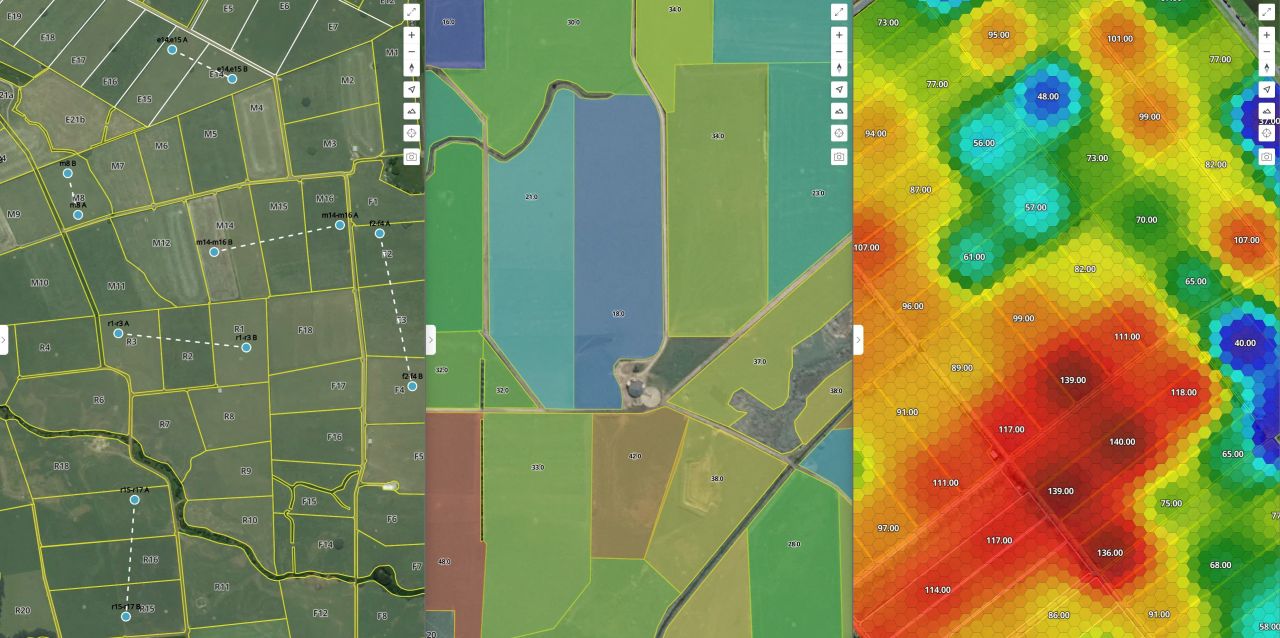
We have found there is significant value just in taking the results from a table format to plotting and colour coding them on an interactive farm map. Even though the granularity of the data is not at the level of a grid analysis it still allows the data to tell a story. For transects that story is often one of maybe we should have done a few more tests to understand our farm better – and for all paddock it makes it so much easier to visually see trends geospatially.
Today we are excited to announce that we have released a new version of our dashboard which has a trial period and can be used by anybody at no cost for 30 days.
All you need to have to get started is a zipped up shapefile of your farm boundaries and the csv file you received from one of the labs here in New Zealand (we are working to expand the list of lab data we can ingest).
There are a number of features in the dashboard, but at a high level you are able to upload and view soil analysis, recommendations and proof of application data across one or many farms, seasons and crops.
The sign up form will take you no more than a minute to complete. During the trial period you can invite your consultant so they too can have access.
If you see deficiencies and/or variation in your nutrient availability and would like independent advice then you can employ the services of either Revive Soil Solutions NZ or one of our partner consultants who can work with you to build a data driven annual plan into your dashboard that you can trust.
Dashboard update